Introduction
CTO.ai stands as a prominent CI/CD tool that aids in automating the deployment pipeline. In tandem, AWS CloudWatch facilitates real-time monitoring of your resources on AWS. Combining CTO.ai with AWS CloudWatch equips you with a powerful toolkit to monitor and analyze your CI/CD pipelines effectively.
In this blog, we will guide you on creating custom dashboards in AWS CloudWatch to enhance your CTO.ai workflows.
Preliminary Steps
Before creating a custom dashboard, ensure that your AWS and CTO.ai environments are correctly configured and that necessary permissions are set up for integration. Before moving on with this tutorial, set up your AWS infrastructure using our AWS open-source workflows here. You can use either the AWS ECS Fargate workflow or the AWS EKS EC2 ASG workflow.
Next, set up and add your secret keys, AWS_ACCESS_KEY_ID AWS_SECRET_ACCESS_KEY AWS_ACCOUNT_NUMBER, and GITHUB_TOKEN with write permissions to the project secret settings in CTO.ai.
Install AWS CLI
Ensure that the AWS Command Line Interface (CLI) is installed and configured in your local machine or application directory.
Next, the AWS application you want to deploy to AWS and create an ops.yml file with your job description, pipeline steps, dependencies, and secret reference. We have a sample ops.yml template you can edit or use similarly in your application directory.
version: "1"
pipelines:
  - name: sample-expressjs-pipeline-aws-ecs-fargate:0.1.1
    description: build a release for deployment
    env:
      static:
        - DEBIAN_FRONTEND=noninteractive
        - ORG=workflows-sh
        - REPO=sample-expressjs-aws-ecs-fargate
        - AWS_REGION=us-west-1
        - STACK_TYPE=aws-ecs-fargate
      secrets:
        - GITHUB_TOKEN
        - AWS_ACCESS_KEY_ID
        - AWS_SECRET_ACCESS_KEY
        - AWS_ACCOUNT_NUMBER
    events:
      - "github:workflows-sh/sample-expressjs-aws-ecs-fargate:pull_request.merged"
      - "github:workflows-sh/sample-expressjs-aws-ecs-fargate:pull_request.opened"
      - "github:workflows-sh/sample-expressjs-aws-ecs-fargate:pull_request.synchronize"
    jobs:
      - name: sample-expressjs-build-job-aws-ecs-fargate
        description: sample-expressjs build step
        packages:
          - git
          - unzip
          - python
        steps:
          - curl "https://awscli.amazonaws.com/awscli-exe-linux-x86_64.zip" -o "awscliv2.zip"
          - unzip awscliv2.zip
          - sudo ./aws/install
          - aws --version
          - aws configure set aws_access_key_id $AWS_ACCESS_KEY_ID
          - aws configure set aws_secret_access_key $AWS_SECRET_ACCESS_KEY
          - aws configure set region $AWS_REGION
          - git clone https://$GITHUB_TOKEN:[email protected]/$ORG/$REPO
          - cd $REPO && ls -asl
          - git fetch && git checkout $REF
          - aws ecr get-login-password --region $AWS_REGION | docker login --username AWS --password-stdin $AWS_ACCOUNT_NUMBER.dkr.ecr.$AWS_REGION.amazonaws.com/$REPO
          - docker build -f Dockerfile -t $AWS_ACCOUNT_NUMBER.dkr.ecr.$AWS_REGION.amazonaws.com/$REPO-$STACK_TYPE:$REF .
          - docker push $AWS_ACCOUNT_NUMBER.dkr.ecr.$AWS_REGION.amazonaws.com/$REPO-$STACK_TYPE:$REF
          # AWS CloudWatch Integration Steps
          - echo "Sending dummy metrics to CloudWatch"
AWS CloudWatch Integration Commands
Next, run the following AWS CloudWatch commands to integrate your worklow so you can cerate your dashboards.
- aws cloudwatch put-metric-data --metric-name DummyMetric --namespace "CTO.ai/Custom" --value 1
- echo "Fetching the recent logs"
- aws logs create-log-group --log-group-name "CTO-ai-Logs"
- aws logs create-log-stream --log-group-name "CTO-ai-Logs" --log-stream-name "BuildStream"
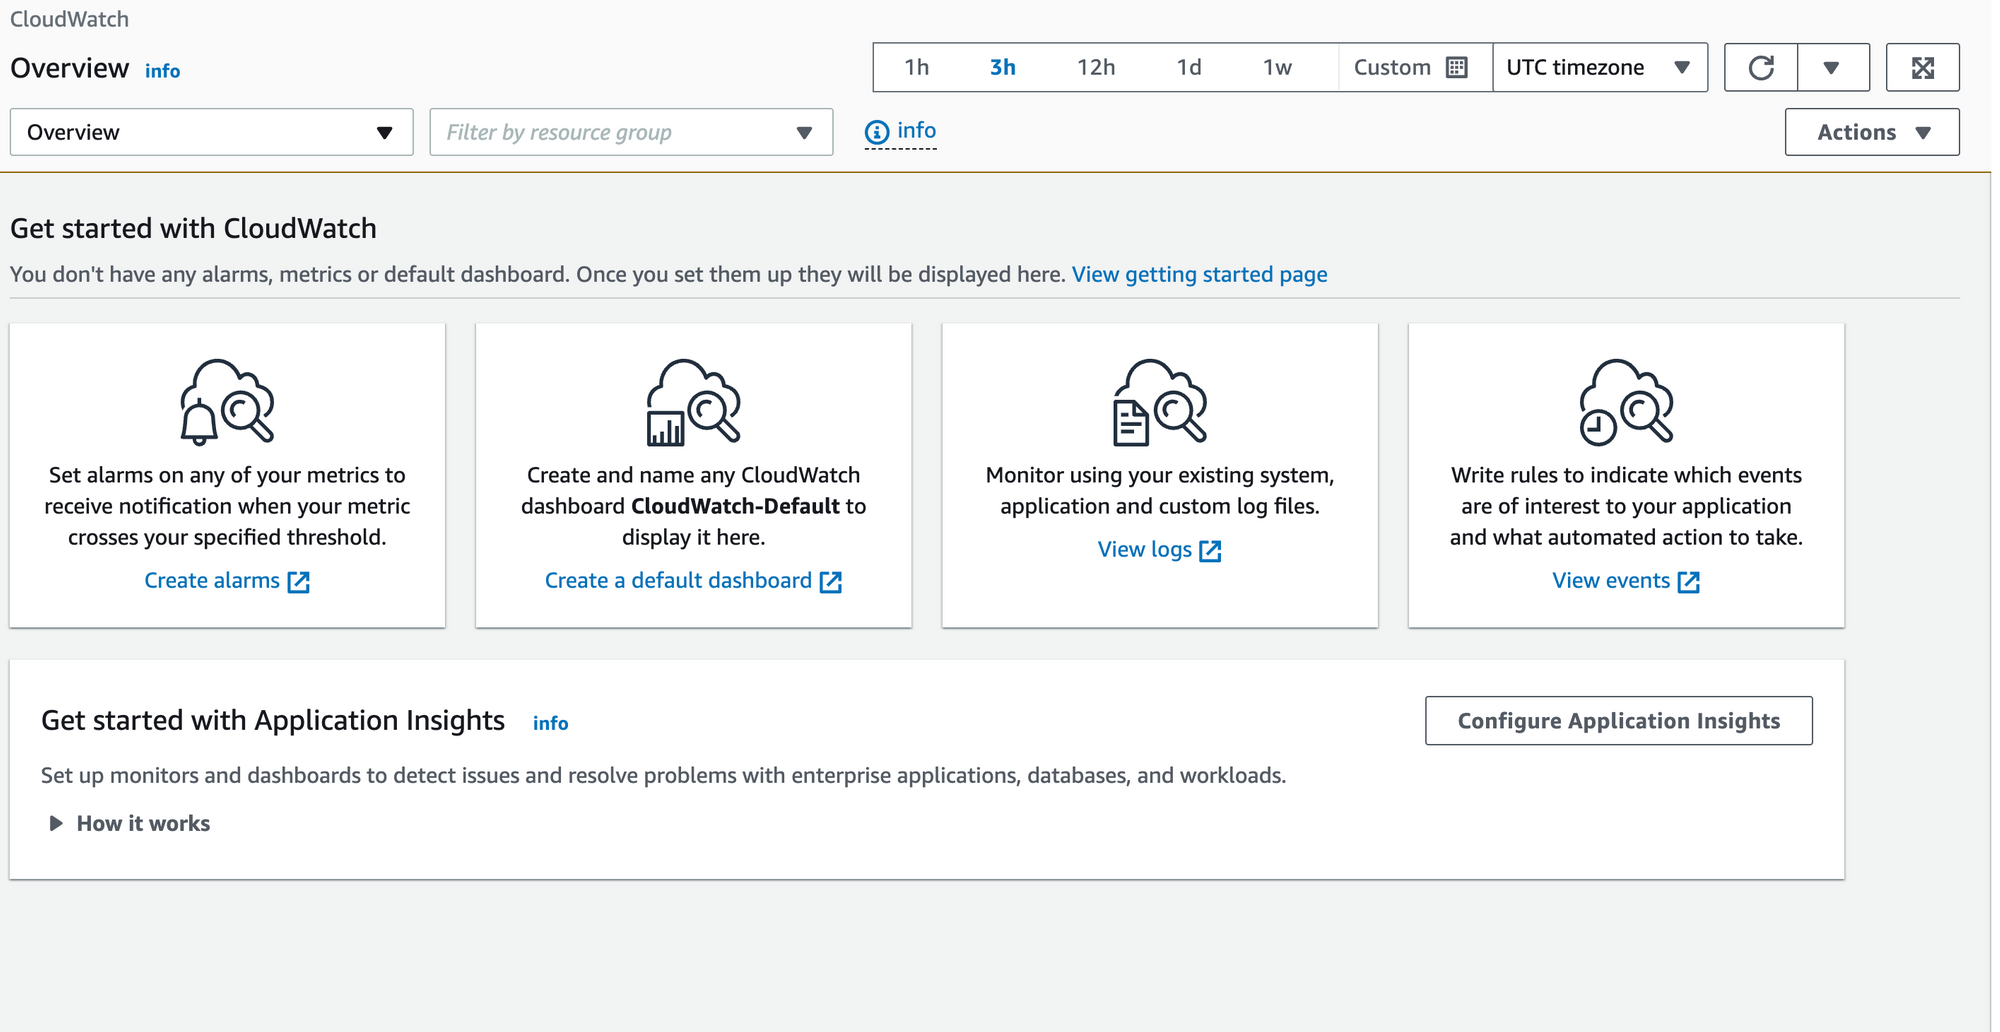
- aws logs put-log-events --log-group-name "CTO-ai-Logs" --log-stream-name "BuildStream" --log-events timestamp=$(date +%s)000,message="Dummy Log Message for CTO.ai"When your application is deployed and running in AWS, the application will be triggered when you push new changes to GitHub, or you trigger the GitHub event triggers. Next, proceed to create a custom dashboard with AWS CloudWatch. Log in to your AWS Management Console and navigate to the CloudWatch service.
Create Dashboard
Click on Create Dashboard, assign a name reflecting its purpose, and click Create.
Choose Widgets
Dashboards are built using widgets which can visualize different metrics and logs. The critical widgets for CTO.ai workflows include:
- Metric Widgets: To visualize and monitor various metrics related to the CI/CD pipeline.
- Query Widgets: To harness insights from the logs.
- Text Widgets: To include explanatory text or instructions on the dashboard.
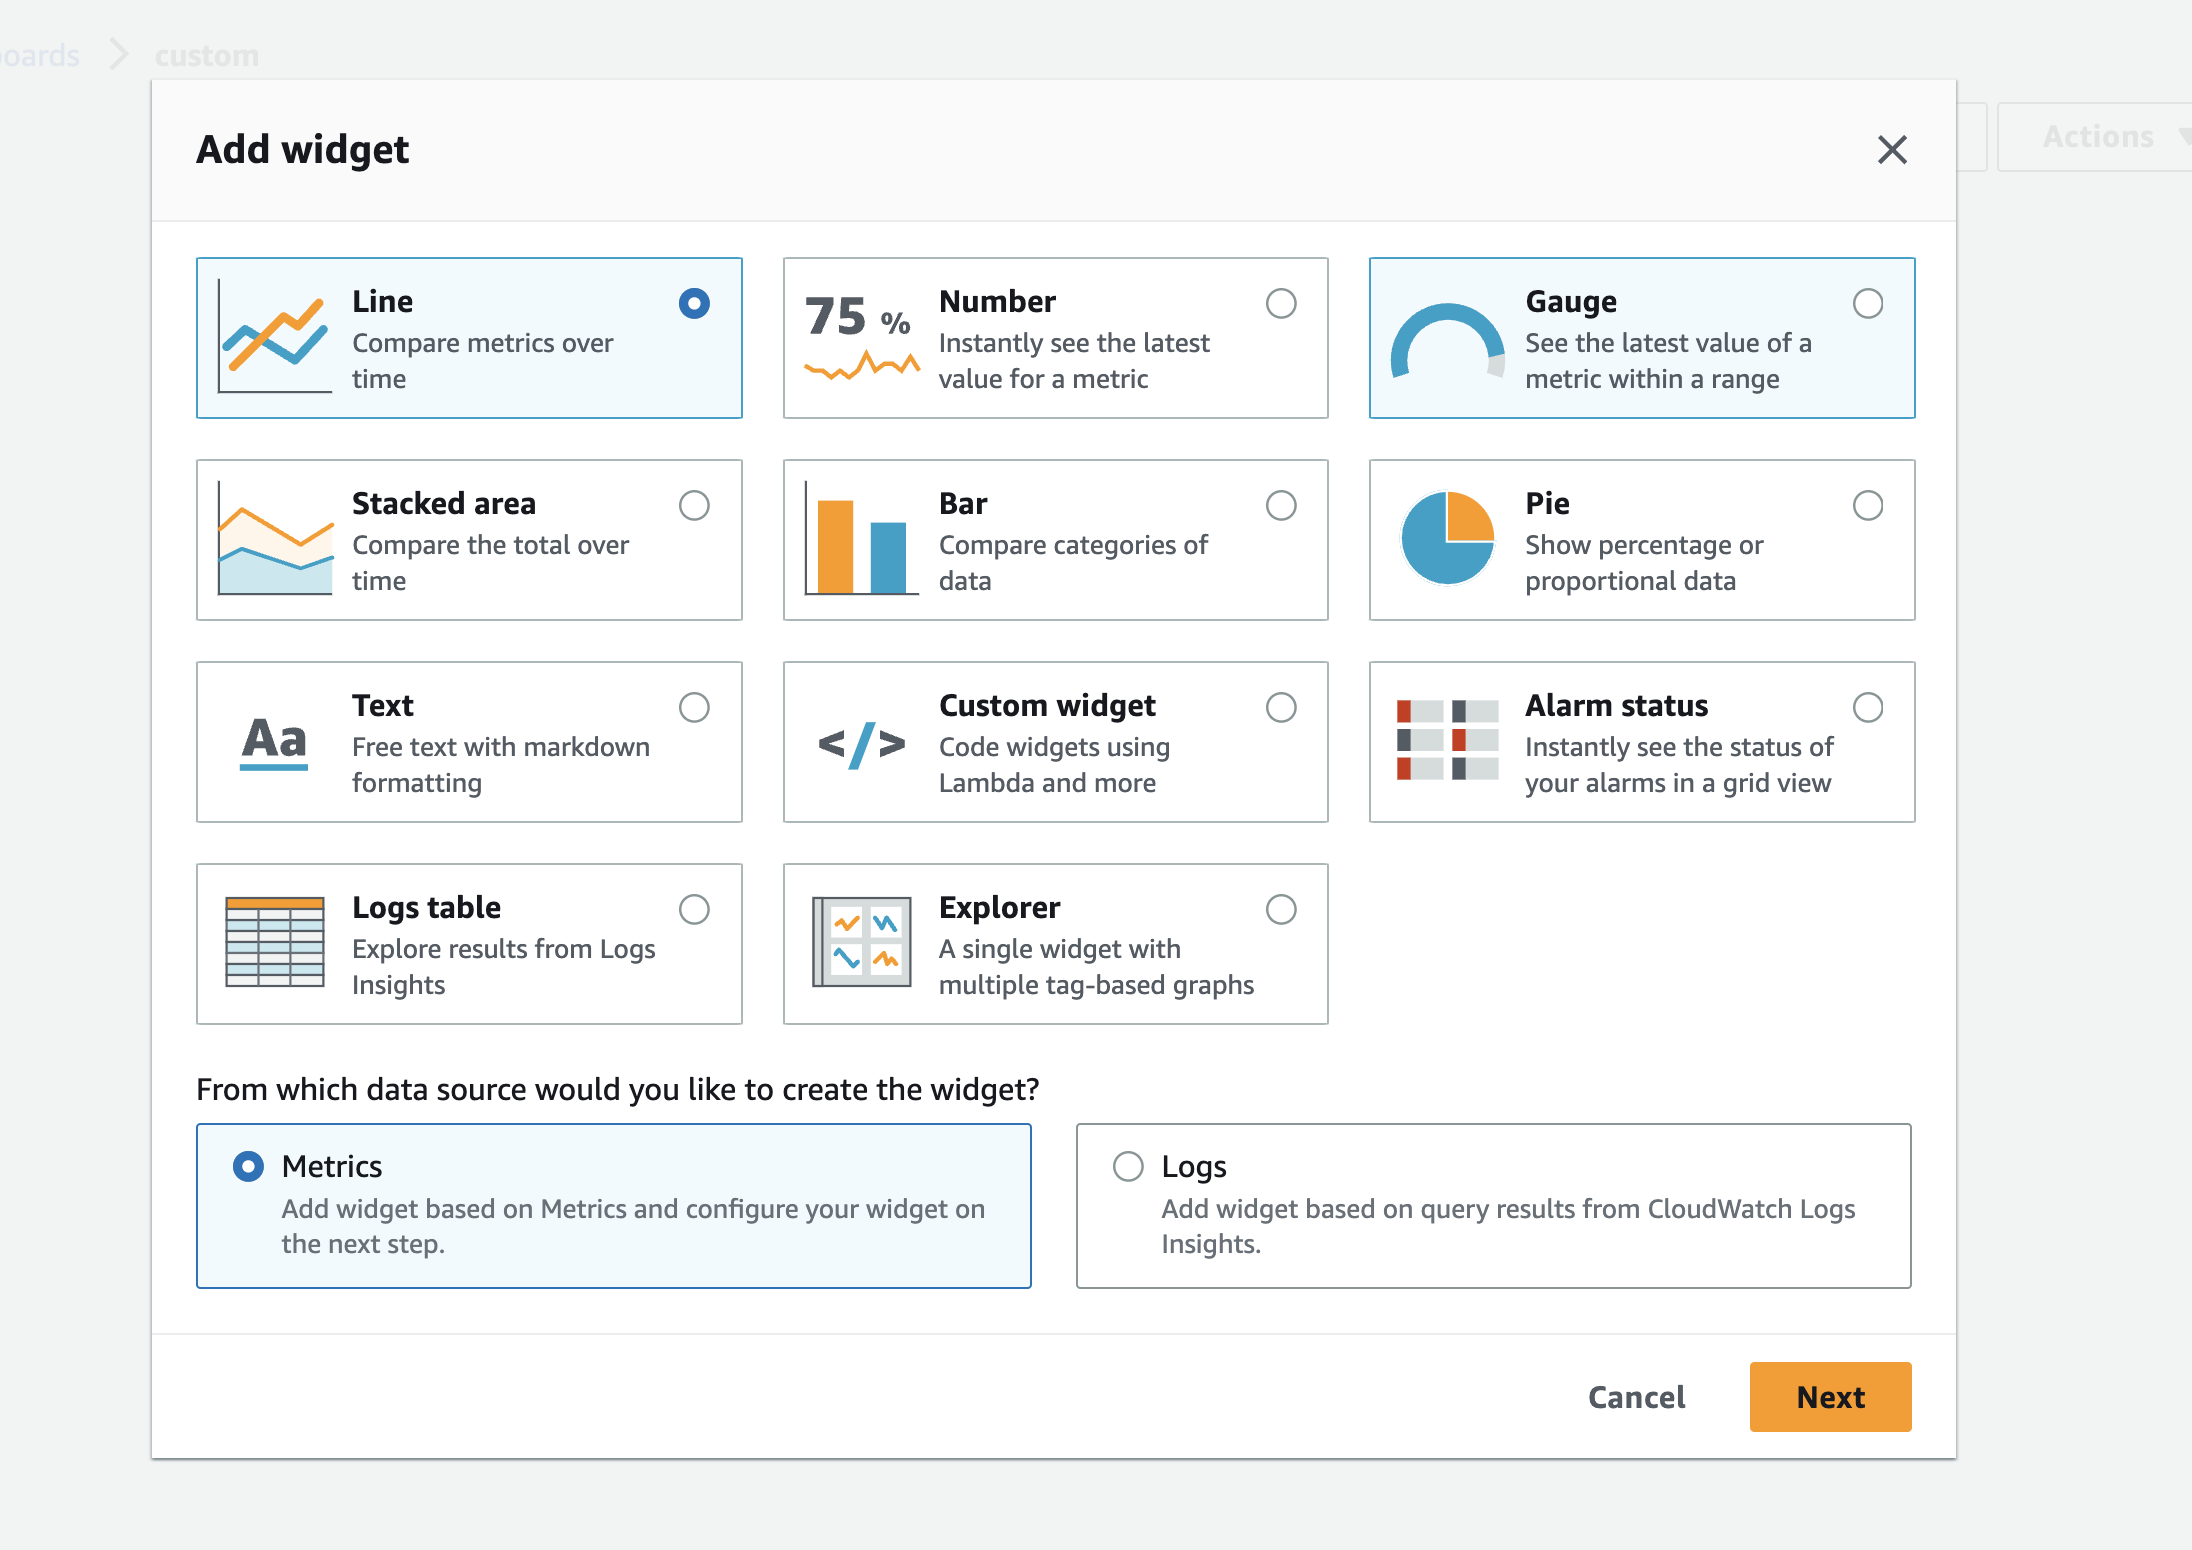
Configure your widgets and tailor each widget to your requirements, defining parameters such as metrics to monitor, the period for the metrics, and the necessary thresholds for the alerts.
Using CloudWatch for CTO.ai Workflows
To make the most of your CloudWatch dashboard for CTO.ai, you can also focus on:
- Tracking Errors and Failures: Implement widgets to monitor errors and failures, helping you to address issues promptly and maintain a healthy CI/CD pipeline.
- Alerting System: Utilize CloudWatch Alarms to set up a robust alerting system, notifying the team of any critical issues in real time.
Conclusion
Creating a custom dashboard in AWS CloudWatch for CTO.ai workflows not only promotes real-time monitoring but also fosters efficiency and productivity in CI/CD pipelines. Start building your custom dashboard today and witness a transformative change in your application with CTO.ai workflows.
Ready to unlock the power of CTO.ai for your team? Schedule your consultation now with one of our experts today!
Comments