
Insights Reports, a new feature we’ve launched on the CTO.ai Insights Dashboard, provides scheduled (or on-demand) snapshots of your team's performance—as measured by DORA Metrics. These reports also include a Kudos Digest, which helps you understand what works for your team by highlighting effective processes from within your organization.
If you’ve been using CTO.ai for some time now, you’re likely already familiar with how the CTO.ai platform can receive Lifecycle Events—from your integrated development tools, workflows run on our platform, or calls to the API—then display your data on the Insights Dashboard. With this update, we’re adding new reporting capabilities, computing an extra set of (12 additional!) metrics, and highlighting what’s working within your team.
A lot of developers recoil at the idea of measuring “developer productivity,” and for good reason—that’s why the full set of metrics we provide here are focused on measuring the developer experience and its effectiveness!
It can be particularly difficult to understand what impact changes to a process will have going forward, especially when it comes to identifying the elements of your team's development lifecycle that may add unnecessary friction down the road. With Insights Reports providing periodic snapshots of your team’s overall effectiveness, it becomes much easier to identify when changes to processes aren’t having their intended effect.
Understand the Effectiveness of Your Developer Experience
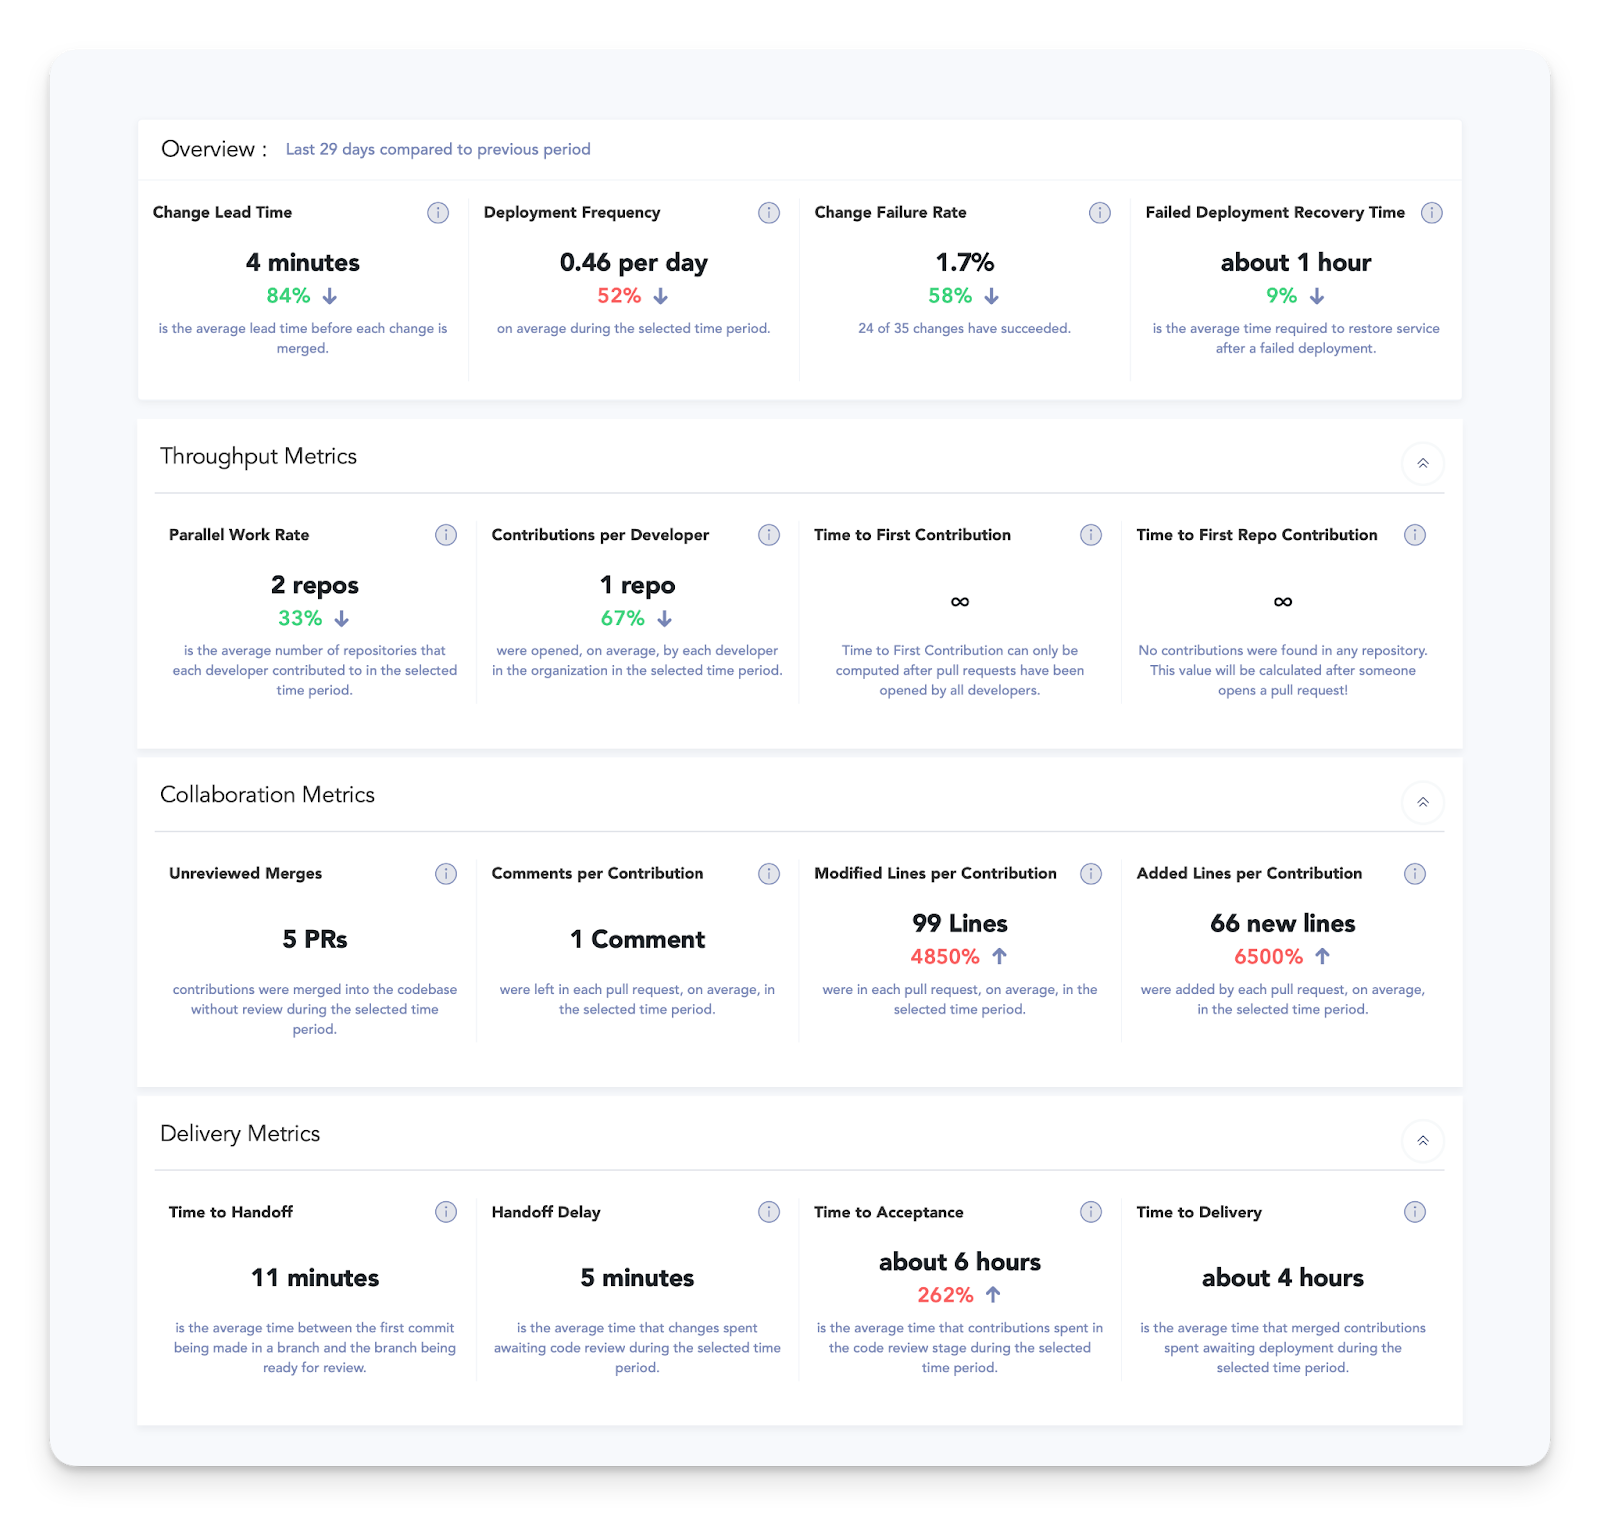
The Insights Dashboard can provide you with a high-level overview of your team's deployment velocity, the reliability of your deployment processes, and how robustly your cloud infrastructure can recover from failed deployments. These DORA Metrics provide actionable insights that can guide your team’s implementation of improved deployment processes and development practices.
Because the DORA Metrics are generated from empirical data collected by our platform, Insights Reports provide a concrete snapshot of your team's performance, which you can save to query in the future—or even schedule to be sent to stakeholders via Slack and email on a recurring basis.
And with the Kudos Digest on each report highlighting which of your team’s repositories have had the most effective performance during the report’s time range, you can identify the processes that reduce friction in your development workflow and emulate them on other repositories and projects.
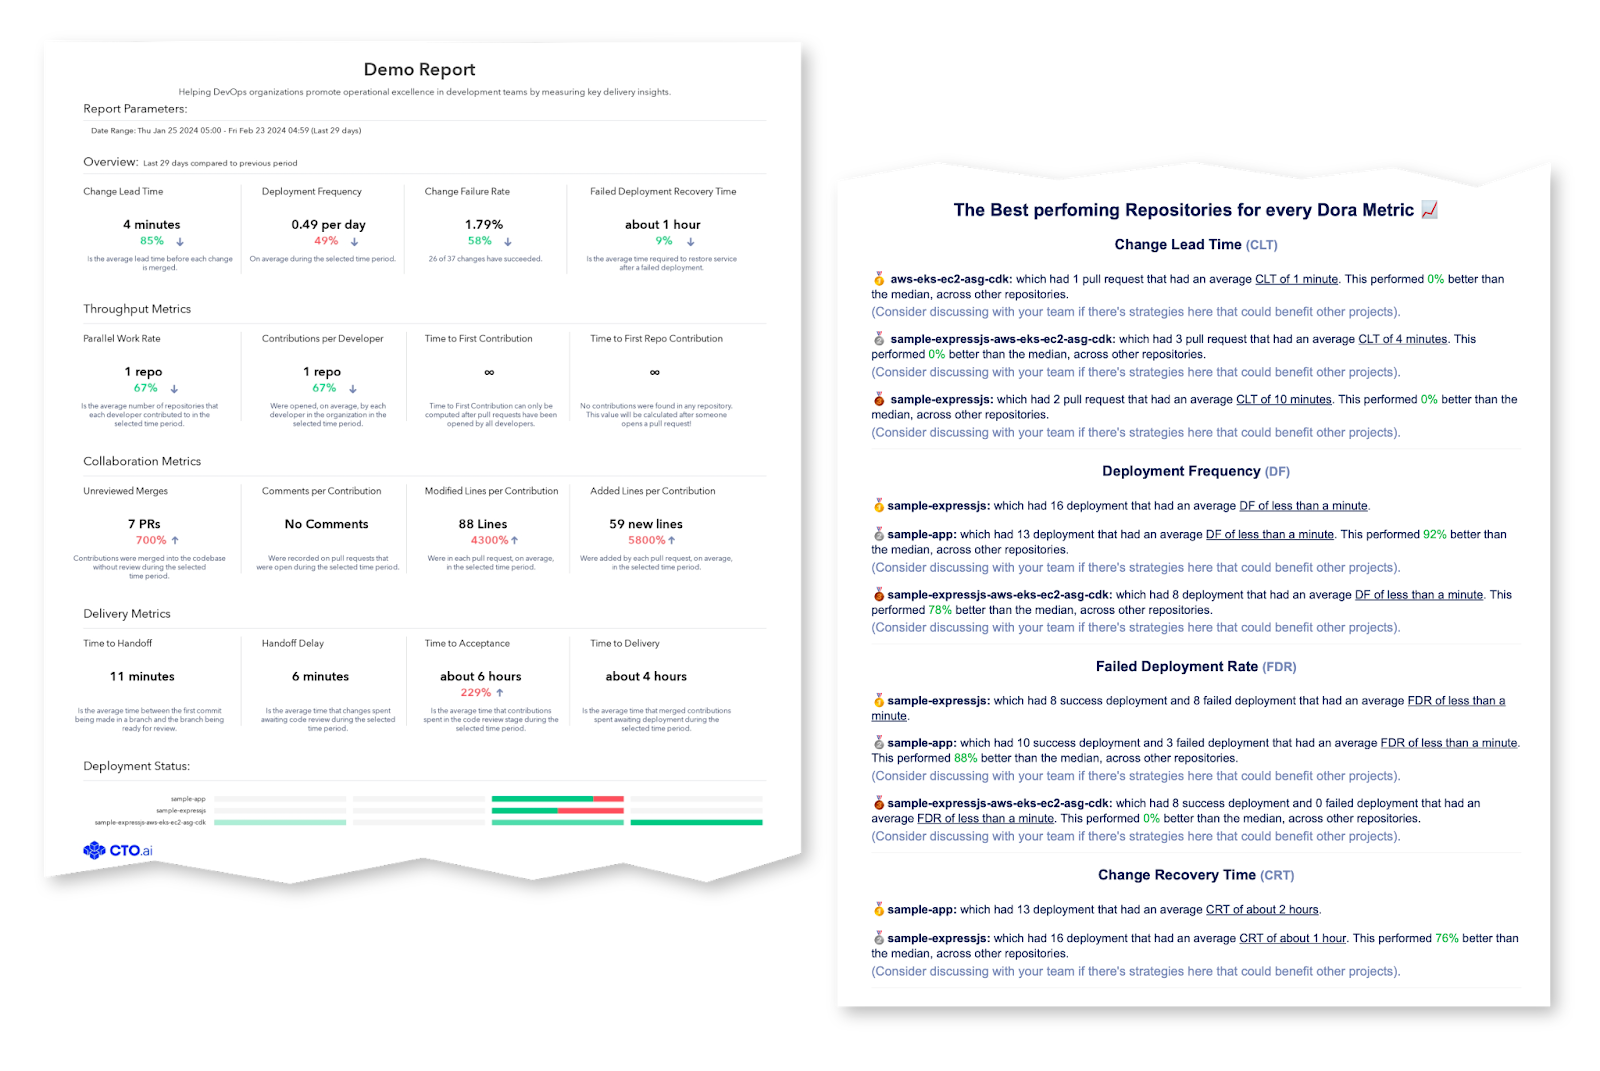
The Kudos Digest included with each report shows up to three repositories that ranked highest for each DORA Metric, with a weighted ranking that surfaces the repos that are both high-performing and high-impact. This feature is meant to make it easier to interpret your metrics and make actionable decisions based on your data.
Improve Your Developer Experience—Using Data
Reports provide a snapshot of your team's effectiveness at regularly scheduled intervals. By reviewing these snapshots as a team, it becomes possible to identify areas for improving your Developer Experience and acts as a foundation for continuous improvement and optimization of your processes.
As you implement changes to your development process, these regular snapshots of the effectiveness of your developer experience will provide you with a concrete idea of the impact of those changes.
Creating Reports
After using the Filtering Bar to filter your data by repository, author, and label, and the Time Filter to select the appropriate range on the Insights Dashboard, clicking the Save button will allow you to store your query for future use. Saved Searches store your filters together with a unique name and an optional description of what the query is meant to represent.
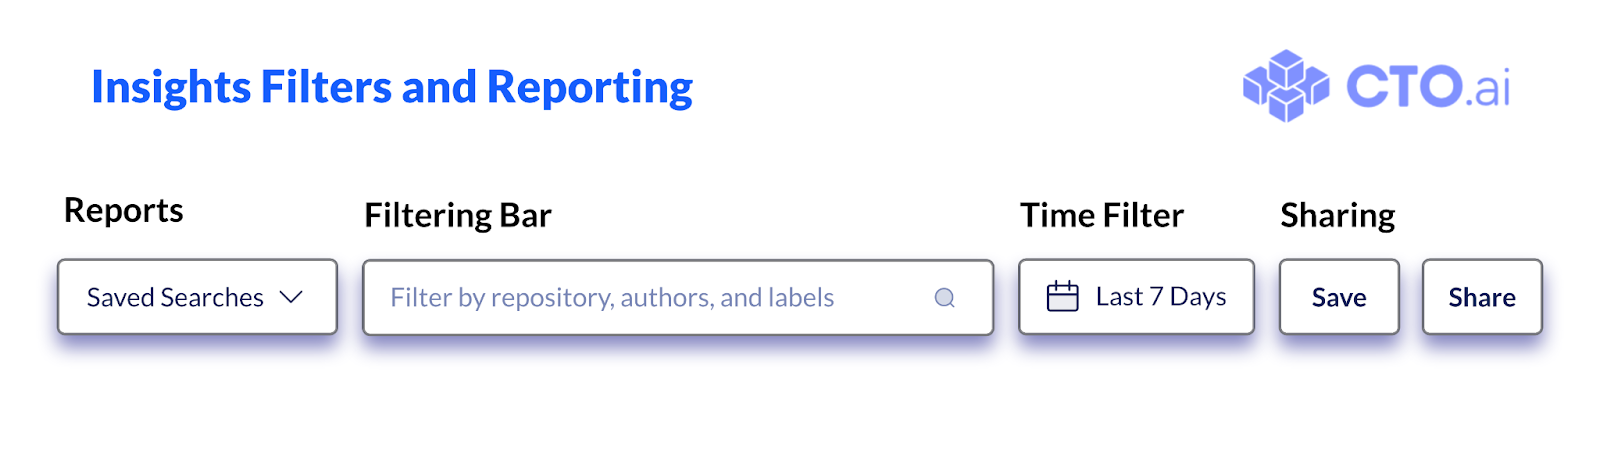
The next time you need to run a given query, selecting it from the Reports dropdown box will load the filters you have saved. For more information on using and managing Saved Searches on your Insights Dashboard, have a look at our docs.
Automate Your Reporting
On top of saving filters for future use, Insights Reports provide multiple ways of sharing the current Insights Dashboard view: by immediately copying a link to the current selection of filters, sending the report via Slack and email, or scheduling a recurring report to be sent automatically.
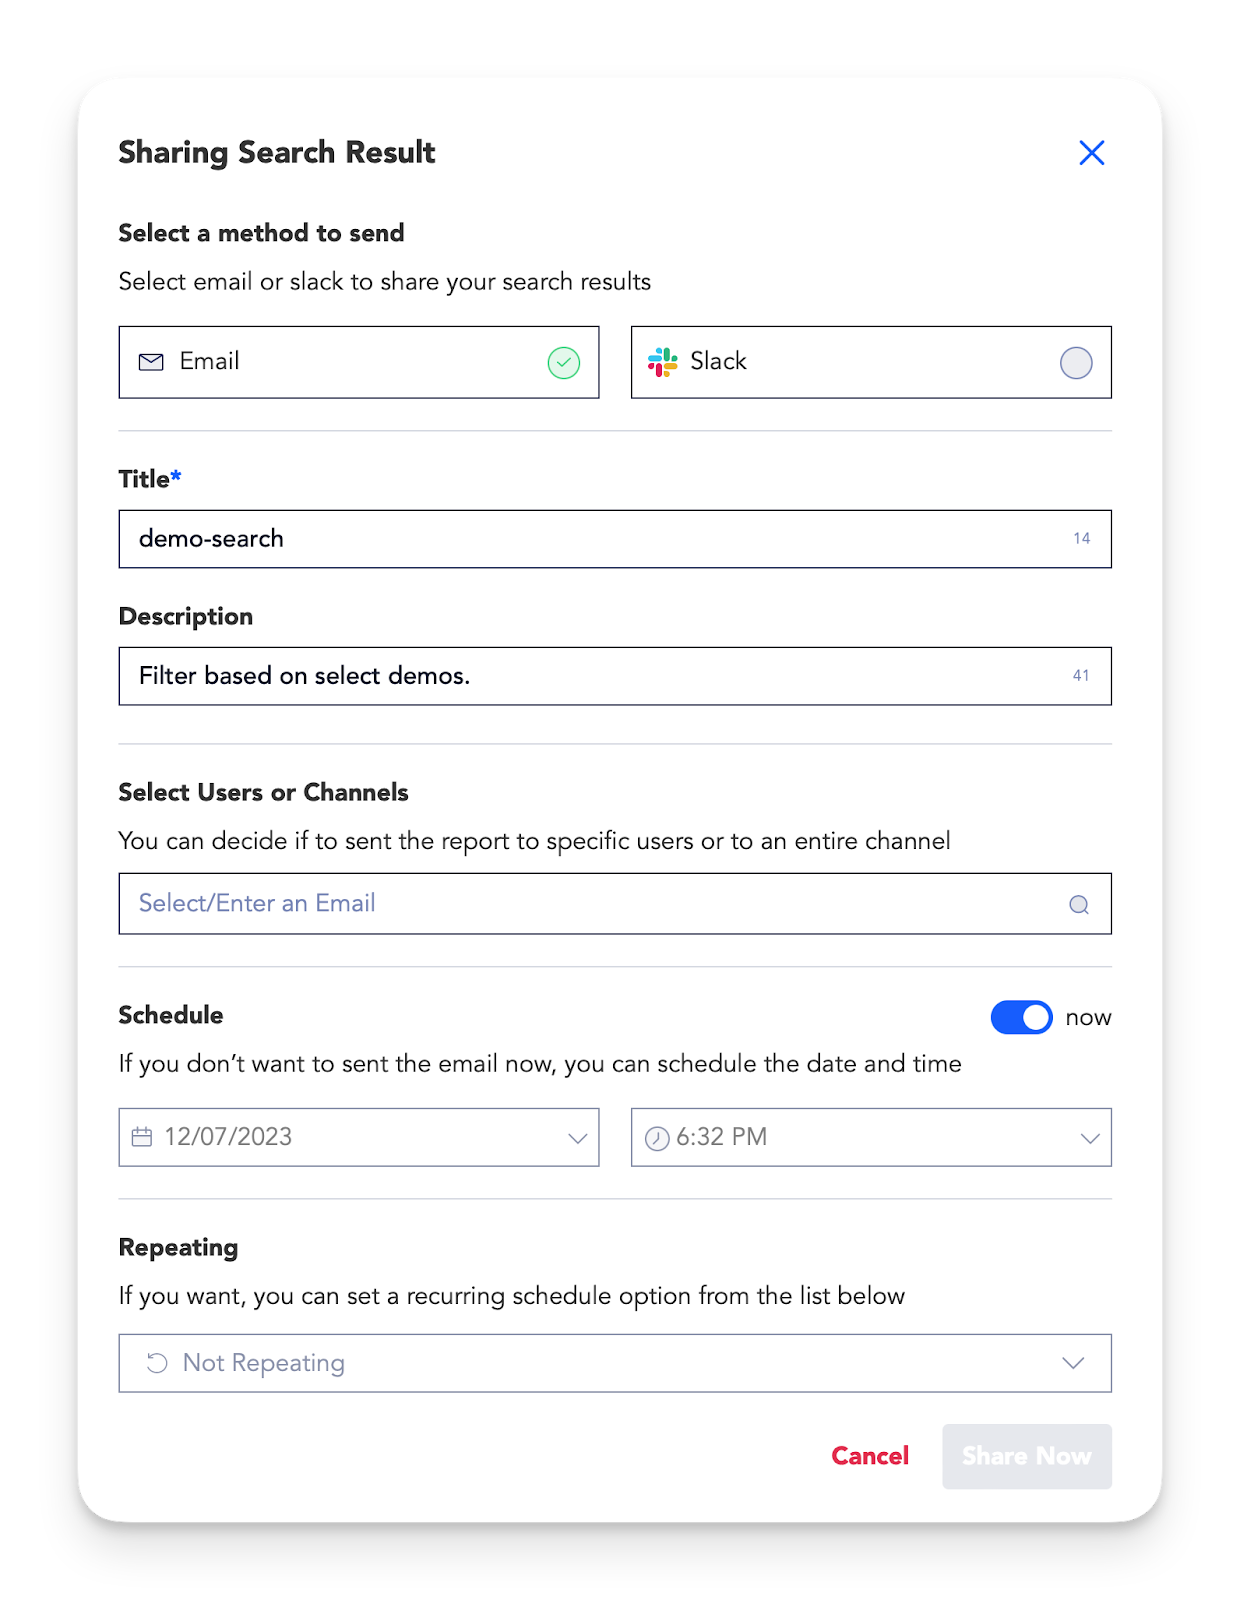
Beside the Save button on the Insights Filter and Reporting bar, you’ll find the Share button, which will let you choose between copying a link immediately and sending a report via Slack or email. When you choose to send a report, you’ll be prompted with the Sharing Search Result modal (pictured above).
For more information on our Insights Reports features, including how you can manage your recurring reports and view the history of sent reports, our Insights Reports documentation will answer any questions you may have!
Want to see this feature in action? Book a feature demo with one of our experts today!
Comments