Insights Events and DORA Metrics
What are Insights Events?
Insights Events (a subset of Lifecycle Events) are what the CTO.ai platform collects to measure the effectiveness of your DevOps practices—how often you deploy, the length of your development cycle, and how often your deployments fail—with DORA Metrics. Insights Events represent your team’s activity on the CTO.ai platform and integrated development tools, such as GitHub.
We classify Insights Events into two types: Deployment Events and Change Events. Generally speaking, Change Events represent activity within a codebase (such as the stages of the development cycle within your team’s GitHub repository), while Deployment Events represent activity on your infrastructure (such as the process that deploys your code to your application environment).
Gain Insight with DORA Metrics
As a team grows, it becomes more difficult to measure the effectiveness of processes. Likewise, as infrastructure complexity grows, “reliability” becomes a complicated concept on its own, and consistently measuring infrastructure performance in this way is difficult. Insights Events serve as data points to assess how your processes enable developer productivity and infrastructure reliability.
| Definition | |
|---|---|
| Deployment Frequency | Average number of deployments per day. |
| Change Lead Time | Average amount of time required for a commit to be deployed. |
| Change Failure Rate | Percentage of deployments that fail to complete successfully. |
| Failed Deployment Recovery Time | Average amount of time required to roll back a change. |
We use Insights Events to calculate DORA Metrics, a research-backed set of indicators for measuring the effectiveness of your DevOps processes.
DORA Metrics Definitions
Below are the definitions of the DORA Metrics we calculate as part of our Insights feature, as well as an explanation of what each metric can indicate.
Change Lead Time
Change Lead Time (also referred to as Lead Time for Change) is the average amount of time required for a commit to be deployed.

When your team has effective processes in place that enable developers to deploy code to production with minimal friction, your team will begin to see a decrease in the length of its development feedback cycle. When developers can make changes to production in smaller batches, they can more quickly identify and fix issues.
Deployment Frequency
Deployment Frequency is the number of deployments per unit of time.

As your tooling and configurations mature, you should be able to deploy more frequently. When effective DevOps processes help prevent human error from entering the deployment process, you can deploy more often without fear of breaking your infrastructure.
Change Failure Rate
Change Failure Rate (also referred to as Deployment Failure Rate) is the percentage of deployments that fail to complete successfully.

With effective processes and reliable infrastructure in place, your team should expect the percentage of deployments that fail or need to be cancelled to decrease over time. This metric would serve as a proxy for the effectiveness of a team’s deployment processes as they shift to smaller, more frequent deployments from larger, more complex deployments.
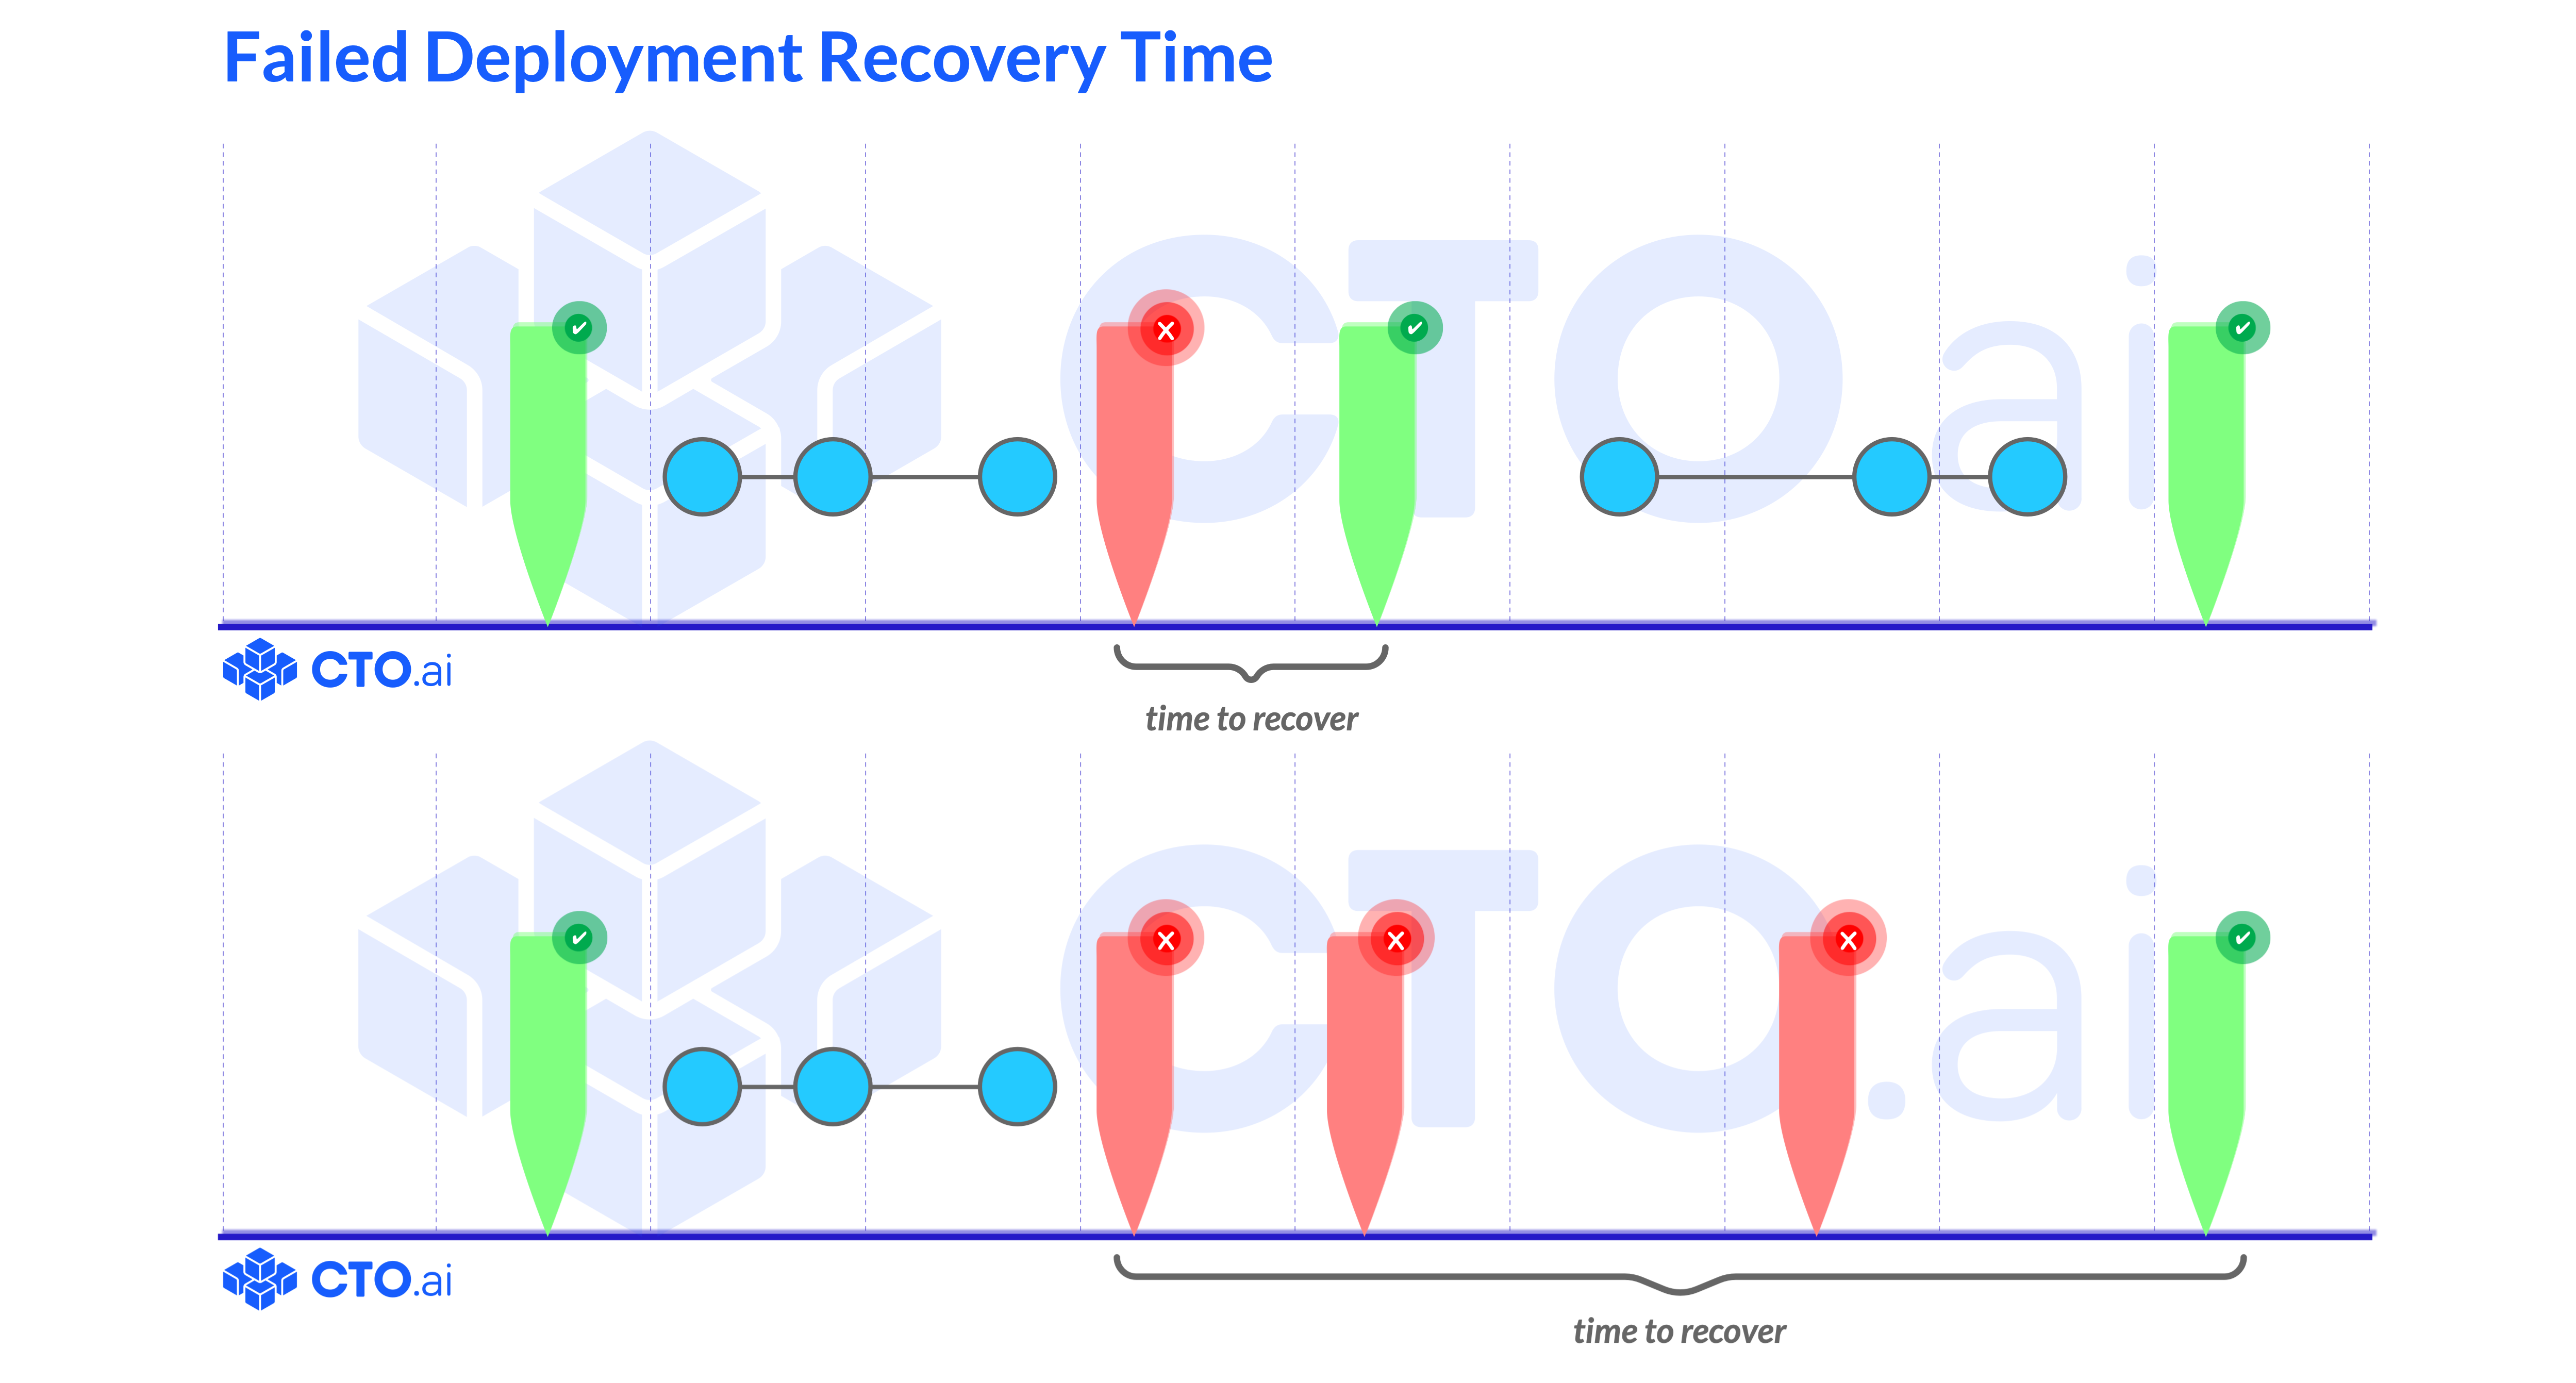
Failed Deployment Recovery Time
Failed Deployment Recovery Time (FDRT) is the average amount of time it takes to roll back a change.

Of course, even a process that accounts for everything the designer can think of will fail when a new situation is encountered. When things go wrong, your team needs a way to revert the changes quickly; this metric assesses how your developer experience enables the rollback of failed changes.