Filtering Insights
From the Insights Dashboard, you can filter your results to only include data that matches your desired condition.
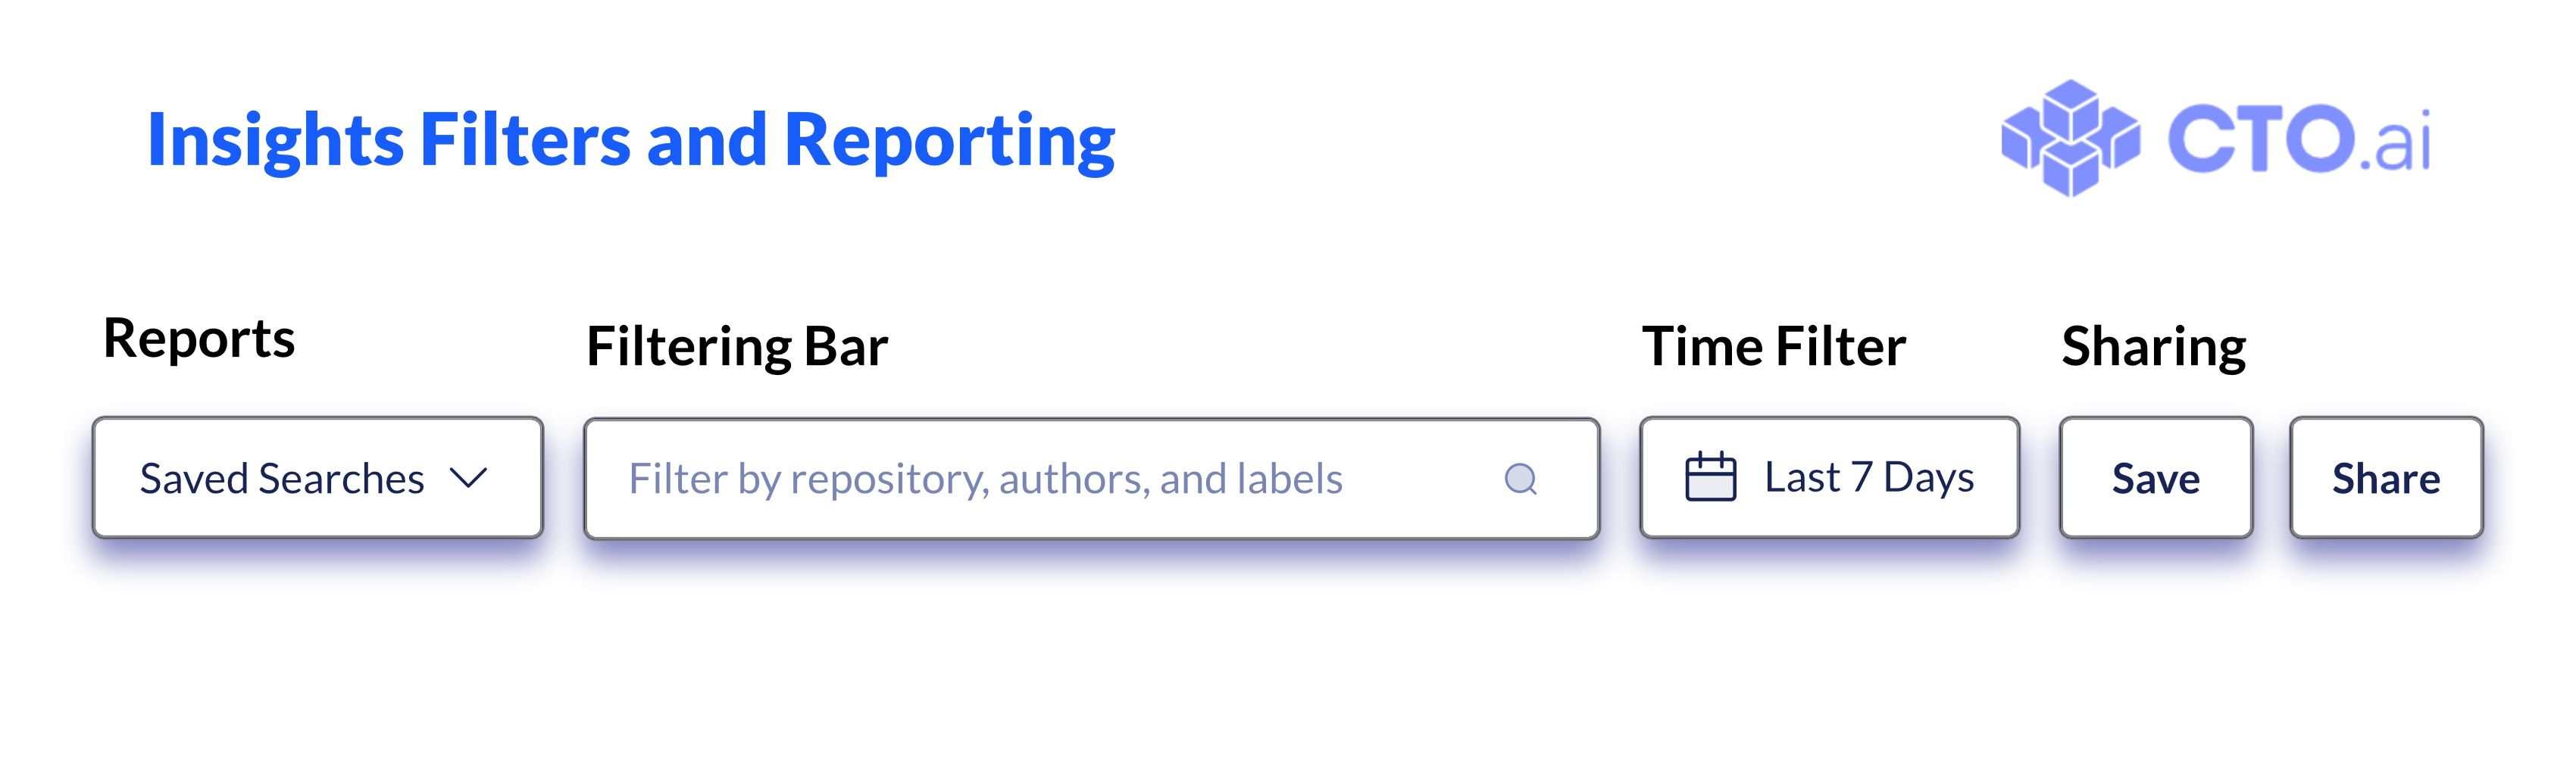
The Filtering Bar allows you to limit the data displayed on the Insights Dashboard to only those events which match the Repository, Author, or Label field values you specify. The Time Filter allows you to define the reporting period for which data should be displayed on the Dashboard.
The Reports dropdown menu allows you to select a pre-defined Insights Report to view, and the Sharing buttons (Save and Share) allow you to save your current Insights Dashboard view as a new saved search or schedule it as a recurring report to be shared.
Additional information about these features can also be found on the Insights Dashboard and Insights Reports pages.
Filter by Value
To filter the data displayed on the Insights Dashboard to only show data that matches your desired conditions, click on the Filtering Bar and select the options that create your desired filter.
The first option you will see on the Filtering Bar is the Field Selector, where you can specify which field you want to compare your data against. You can filter your Insights data based on the values of the following fields:
- Repository
- Author
- Label

After selecting which field you wish to filter against, the Comparison Selector provides the various tests you can use to filter the data displayed on your Insights Dashboard:
- Equal
- Excludes
- Starts With
- Ends With
- Contains
Finally, the third dropdown box, the Value Selector, displays the existing options for the selected field, allowing you to define which value should be used in the filter’s comparison. Select a value from the dropdown box or enter your own value into the box that appears above the dropdown options.
The filter you have just created will limit the data shown to only include data where the field chosen in the Field Selector has a value that matches the value in the Value Selector when compared using the operator in the Comparison Selector box.
Filter by Date
To filter the data displayed on the Insights Dashboard to only show data from a specific period of time, click on the Time Filter and select the days you wish to include in the report.

The menu that appears after clicking on the Time Filter provides you with a few pre-defined periods (Last 24 Hours, Last 7 Days, Last 4 Weeks, etc.) that you can select to automatically set a date range for the reporting.
To show data from a specific period of time, click on the Custom option, and on the calendar that is displayed under the Time Filter box, you can select the start and end dates of your desired time period. Then, click Apply to narrow the data displayed to that time period.
About Reporting Periods
When you filter the data on your Insights Dashboard by date, a few things will be affected when your DORA Metrics are calculated.
First, if you are viewing data filtered by a specific custom time period, that date range will be displayed in the Time Filter box (indicated by label “A” in the image below). The reporting period shown in that box is inclusive of the dates at each end of the time period.

Second, all calculated metrics will only use data from the time range you have defined. To help you measure how the performance of your team changes over time, we will compare the aggregate metrics from your current reporting period with the aggregated data from the preceding period of the same length (indicated by label “B” above). That is, if the current reporting period is 11 days long, the previous period is defined as the 11 day period which ends the day before our current period begins.
Finally, for smaller periods of time, repositories with limited data, or teams with a slower development cadence, you may find that there are insufficient data points relevant to some of the metrics; in that case, a message will be displayed explaining why (indicated by label “C” above).