Insights Dashboard
The CTO.ai Insights Dashboard is your entry point for understanding the health of your team and the effectiveness of your DevOps playbook. It provides visibility of the Insights Events collected from your Commands, Pipelines, and Services workflows in one spot, and derives DORA Metrics from that aggregated data.
This page documents the features available through the Insights Dashboard provided by the CTO.ai platform.
Metrics Overview
The Insights Dashboard provides a snapshot of your team’s software delivery effectiveness.
Under the Overview heading of the Insights Dashboard, you will find a summary of your team’s DORA Metrics for the current reporting period (more info on filtering by time below).

The Deployment Status section of the Insights Dashboard shows the proportions of deployments for the given reporting period that have succeeded and failed. Each segment of the timeline represents a sub-unit of the reporting period (days, weeks, etc.), and will be colored in with the status of each of your deployments.

To view the raw data for each segment within the reporting period, hover your mouse of a segment in the Deployment Status section.
Filtering Insights
From the Insights Dashboard, you can filter your results to only include data that matches your desired condition.
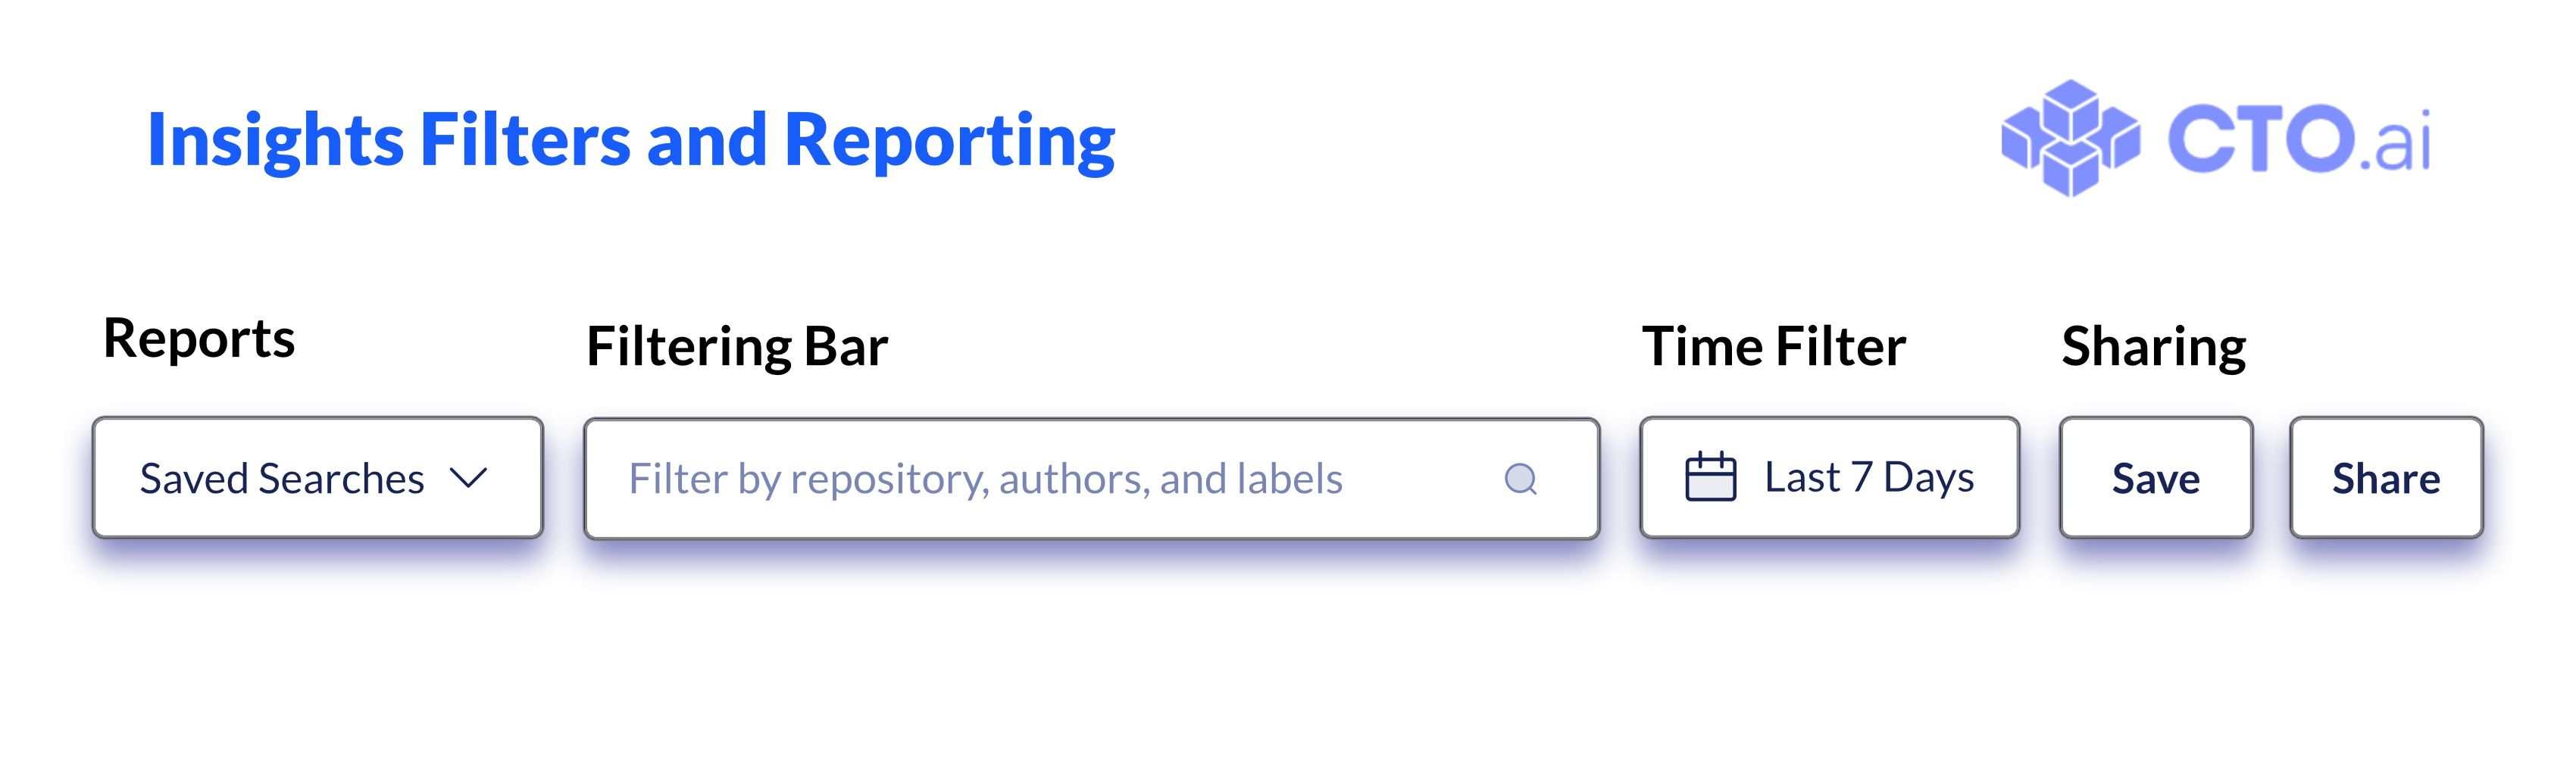
The Filtering Bar allows you to limit the data displayed on the Insights Dashboard to only those events which match the Repository, Author, or Label field values you specify. The Time Filter allows you to define the reporting period for which data should be displayed on the Dashboard.
The Reports dropdown menu allows you to select a pre-defined Insights Report to view, and the Sharing buttons (Save and Share) allow you to save your current Insights Dashboard view as a new saved search or schedule it as a recurring report to be shared.
These features are documented in more detail on the Filtering Insights and Insights Reports pages.
Event Timeline
The Event Timeline on your Insights Dashboard shows you the events that have been collected by the CTO.ai platform from your connected repositories. Each of your connected repositories will be listed as a separate row on the timeline, providing you with a visual summary of the Insights Events collected from your repositories.
Dragging the sliders at each end of the range above your data will refine the time period displayed by the Event Timeline (without modifying the dates of the reporting period currently being examined).

Hover over each datapoint on the timeline to view additional details, such as the repository where that Insights Event originated, the type of event being logged, and the time that the event occurred.
Event Activity
The Event Activity table of your Insights Dashboard is a log of all Lifecycle Events that we have collected from your integrations with the CTO.ai platform. All lifecycle events from the current reporting period are displayed in chronological order as a paginated table.

The meaning of each column in the Event Activity table is defined below.
| Description | |
|---|---|
| Timestamp | Date and time that the event occurred, as recorded by the system that generated the event. |
| Event | Which workflow produced this lifecycle event (source-specific). |
| Action | State that resulted from this action occurring (source- and event-specific). |
| Category | Which workflow type produced this lifecycle event (source-specific). |
| Source | Which source collected this lifecycle event (name of the integration). |
| Repository | Which connected repository produced this lifecycle event. |